| Issue |
Renew. Energy Environ. Sustain.
Volume 3, 2018
|
|
|---|---|---|
| Article Number | 4 | |
| Number of page(s) | 12 | |
| DOI | https://doi.org/10.1051/rees/2018004 | |
| Published online | 05 September 2018 | |
Review Article
Assessment of hydropower resources in Tanzania. A review article
1
Department of Mechanical and Industrial Engineering, University of Dar es Salaam,
P.O. Box 35091,
Dar es Salaam, Tanzania
2
Department of Energy and Process Engineering, Norwegian University of Science and Technology,
7491
Trondheim, Norway
* e-mail: This email address is being protected from spambots. You need JavaScript enabled to view it.
Received:
29
November
2017
Accepted:
18
July
2018
Abstract
The hydropower resources have become an attractive means of generating electricity to the off-grid network, especially in rural areas. This article assesses the small, mini and large hydropower resources and identified to reach 5.3 GW for electricity generation in Tanzania. The technology development discussed comprises of hydro turbine manufacturers, classification and turbine selection. The barriers presented include the presence of sediment in the hydropower reservoirs, financial viability, policy and regulatory issues related to hydropower development. This reviewed article serves the investors and policymakers to understand the status of hydropower resources in Tanzania.
© O.J. Mdee et al., published by EDP Sciences, 2018
 This is an Open Access article distributed under the terms of the Creative Commons Attribution License (http://creativecommons.org/licenses/by/4.0), which permits unrestricted use, distribution, and reproduction in any medium, provided the original work is properly cited.
1 Introduction
The renewable energy sources are exploited more globally due to the rapid increase of energy consumption and reduction of serious pollution to the environment [1]. Renewable energy sources used to generate energy include hydropower, solar, geothermal, wind, bioenergy and oceanic energy sources. Hydropower resources can give more sustainable, reliable and nonpolluting alternative to fossil fuels [2]. Hydropower leads other renewable energy sources to produce the global electricity [3] and is providing about 16.6% from 23.7% of the world's renewable energy sources to produce the global electricity. Although other renewable energy sources contributed to global electricity include wind by 3.7%, bioenergy by 2.0%, solar PV by 1.2%, geothermal, concentrating solar thermal power and ocean by 0.4% [4].
1.1 Energy sources of Tanzania
The energy balance of Tanzania includes the use of charcoal and firewood, petroleum products, coal and renewable energy sources. The charcoal and firewood are dominating the total national energy consumption by 85%, followed by petroleum products for only 9.3%, electricity by 4.5%, coal and renewable energies by 1.2% [5]. The reliable and cheap energy sources contribute the significant role in the social economic development. Tanzania has increased the access to electricity with 36.4% in urban areas and 11% in rural areas up to 2014 [5]. Excluding large hydropower plants, only 4.9% of electricity generated from sisal and sugar factories, solar and small hydropower plants [6]. Two past decades, hydropower plants contribute about 80% of electricity supplies before the commercialization of natural gas in the year 2004 [7]. The total capacity of hydropower plants was 561.84 MW from six power stations [8]. This installed capacity is equivalent to 12% of 4.7 GW identified hydropower resources. But, the available hydropower resource is estimated to be greater than 38 GW [5].
The status of electricity generation by either hydropower resource, natural gas, oil or coal, peat and oil shale from 1971 to 2015 in Tanzania were shown in Figure 1. The natural gas indicated to have the high magnitude to produce the electricity after hydropower due to the five gas power plants installed with the total capacity of 495.44 MW. But, the two off-grid gas power plants indicated to have the capacity of 25.25 MW and eleven off-grid diesel-fired engines power plants have the capacity of 28.682 MW. These power plants with different energy sources make the maximum electricity generation of about 1.1 GW [7]. Nevertheless, hydropower and other sources of renewable energy have become an attractive means of generating electricity where the grid is not feasible [9]. But, the major hydropower reservoirs experienced severe drought in the period from the year 2003 through 2005 [8]. Also, the energy policy and power master plan for the year 2012 and 2016 indicated to rely on the following four energy sources for electricity generation [5,7].
-
To harness the hydropower resources from 561.84 MW to about 4765 MW.
-
To increase the capacity of generating electricity by using natural gas from 495.44 MW to 3507 MW up to the year 2031. The total estimated gas initially in place ranges from 8 TCF in 2005 to 55.08 TCF in 2015.
-
To use coal to generate electricity up to 3800 MW. The coal reserve is estimated at 1.9 billion tonnes of which 25% is proven.
-
To use the renewable energy sources include biomass, solar and wind to install up to 260 MW in the short term planning. The average solar insolation distribution is about 200 W/m2 and wind speed ranges from 5 to 9 m/s.
This article aims to develop the database of hydropower resources, technology development and barriers issues. Therefore, the article examines the developed and undeveloped hydropower resources for the purpose of understanding the past and future trend of hydropower resources contribution to the national energy balance.
2 Hydropower resources assessment
The percentage of undeveloped hydropower potential is the highest in Africa [11]. Panos et al. [12] indicated Sub-saharan Africa remains behind than the rest of the world with a total requirement to access the electricity increases from 31% of the population in 2010 to more than 80% in 2050. The exploitation extent of hydropower resources is only 7.15% in Africa, 37.40% in Oceania, 40.79% in Asia, 44.77% in the Americas and 63.33% in Europe [13]. However, this review article discussed only the hydropower resources available in Tanzania that can either operated or potential identified from different locations. The operated hydropower plants are either large, mini or small hydropower plants.
2.1 Operated large hydropower plant
The capacity of the installed large hydropower reached to 561.84 MW in Tanzania [8]. Table 1 presents the operated six large hydropower plants with the capacity and number of turbine unit, year completed, river allocation and region. The large hydropower allocated to two main rivers of Tanzania includes Rufiji river at the central part of Tanzania toward south-east to the Indian Ocean and Pangani river from Mt. Kilimanjaro to Tanga-Indian Ocean.
2.2 Operated mini and small hydropower plant
The operated mini and small hydropower plants distributed all over the country of Tanzania to the river channels. The mini and small hydropower plants are most installed by the Tanzania Electric Supply Corporation (TANESCO), religious mission or private sectors [14]. Table 2 presents a list of the identified hydropower sites either operated or abandoned due to economic unviable. The repetitive hydropower sites were removed and the one with large capacity remains. The idea is to collect all hydropower sites to have a single database. Table 3 presents the list of under construction/to be constructed hydropower sites and Table 4 presents the list of existing/reconnaissance/pre-feasibility/feasibility studies for hydropower sites. Hydropower potential sites were collected from different sources as indicated in the summary tables. The hydropower sites collected were either connected to the grid in urban services or off-grid to the rural areas.
List of operated/existing/abandoned hydropower sites.
List of under construction/to be installed hydropower sites.
List of existing/reconnaissance/pre-feasibility/feasibility studies for hydropower sites.
2.3 Small hydropower resources
The small-scale hydropower potential accounts for about 300–500 MW, of which only around 24 MW has been economically developed so far [21]. Figure 2 presents the 141 hydropower sites. The hydropower sites were georeferenced and digitized under ArcGIS software. About 56 new hydropower sites found and studies ranged from reconnaissance to pre-feasibility. Hydropower sites identified have the total capacity of 300 MW [15]. Also, Kabaka and Gwang'ombe [22] identified a total of eighty-five (85) small hydropower sites countrywide with a total of 187 MW under TANESCO. The work conducted by using the topographical map reading of the standard 1:50 000 sheets. Furthermore, another study also collected 75 potential hydropower sites with either 77.76 MW off-grid capacities or 408.12 MW connected to the main grid [23]. It based on the desk works and only 11 sites visited for validating the methodology. The latitude and longitude locations of 75 sites overlaid to the map of 141 sites. The map also presented the sites of six operated large hydropower plants in Tanzania.
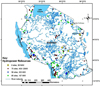 |
Fig. 2 Potential hydropower resources map of Tanzania. |
2.4 Hydropower resources status
The status of hydropower resources identified in Tanzania is presented in Figure 3 that have been added up to 5.3 GW as the expected to be harnessed with the long-term plan up to 2040. If the total large and small operated/existing/abandoned hydropower in Tanzania is about 624.21 MW, then only 12% have been exploited and contributed to the electricity generation. Noting that the hydropower potential is equal to 38 GW in Tanzania [24] and makes only 14% were taken into the energy master plan for electricity generation. The electrical energy produced by using hydropower resource for year 2015/16 is 1732.75 GWh with plant factor range between 20% and 50% as presented in Figure 4 [24]. With the same plants capacity, the annual energy generation should rise up to 4957 GWh if the plants operated for 8760 hours per year that is equivalent to 35% of annual energy generation with average plant factor of 32.4%.
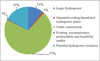 |
Fig. 3 Hydropower resources status in Tanzania. |
3 Hydropower technology
3.1 Classification of hydropower development
The hydropower is the rate at which water energy extracted by hydro turbine from falling water at a specific site. The turbine is the type of turbomachine that utilizing water power to convert water pressure and kinetic energies into mechanical rotational energy. Mechanical rotational energy conveyed with the shaft in one end to the turbine and another end to the electric generator for electricity generation [25]. However, the idea of harnessing water energy started many years ago with considered to exist for 22 centuries. It was started by using the potential energy of water freely moving or fallen over the waterwheel that connected with a belt to direct rotational mechanism to different machines include moving millstones for grinding grains, sledge-hammers for extracting ore deposits, running textile and sawmills machines, pumping water for domestic and irrigation uses [26]. The potential energy of water turns the waterwheel and cause motion to the belt. Water turbine only was emerging from the 1820's and abruptly substitutes the use of waterwheel [27]. The waterwheel is not flexible during flow rate variation resulted in less efficient compared to water turbine [28].
Both water turbine and waterwheel are simply differentiated by using their definition. Water flow in water turbine admitted to all the vanes or buckets simultaneously and controlled by the governor. Waterwheel consists of a large perimeter of wooden or metal wheel with a number of buckets or blades tangentially outside of the rim [29]. Waterwheel receives the water at the top or one side only [30]. The axle of the wheel mounted horizontal or tilted to vertical. The amount of water is flowing in the number of fixed cups circumferential to wheel arranged more closely without any gap to generate rotational mechanism of the wheel that connected to belts or gears. Table 5 presents the machine type and flow directional for hydropower plants. The details of the head, flow rate and output power were listed in Loots et al. [31]. Furthermore, the hydropower classified by using the plant capacity, head, as well as the means of operation and capacity of water flow to the turbine as shown in Table 6.
Hydropower development classification.
3.2 Turbine manufacturers
A lot of turbine manufacturers are available globally and linked with online access. Table 7 presents only some manufacturers of hydropower components include turbine, generators, transformer, valves, steel penstock, gate, motor, steel pole and relevant structures. The local developers can visit the local technical school, vocational education and training authorities and universities to find the possibility of manufacturing the hydro turbine components. A Salala hydropower plant of 68 kW installed by using the cross-flow turbine with attached components was manufactured at the College of Engineering and Technology, University of Dar es Salaam, Tanzania [21].
List of hydro turbine and manufacturers.
3.3 Turbine selection
The net available head (H) and flow rate (Q) are the main factors to consider during turbine selection as presented in Figure 5. Different types of turbine include Francis, Kaplan, Propeller, Pelton, Turgo, Pump as Turbine and Crossflow turbines were discussed in [44]. The net head is the gross head minus head losses. Head losses calculated as in [32]. Other factors should be considered include specific speed, efficiency and flow variation. Williamson et al. [45] suggested using the multi-criteria analysis and weighted values assigned to various aspects presented in Table 8. Also, the electrical components should be sizeable based on the mechanical rotational energy from turbine [46].
4 Barriers of hydropower development
The hydropower development barrier is the circumstance or obstacle to the project that prevents more production from generating the profit. The sediment and agriculture activities indicated to be the main barriers to hydropower development in Tanzania. The accumulation of sediment in a reservoir is a serious challenge that threatens the sustainability of the hydropower plants [50]. The accumulated sediment reduces the storage capacity of the reservoir [51]. The sustainable sediment management strategies for reservoirs should balance sediment inflow and discharge at the same time to maximize the storage volume [52]. The high sediment concentration together with the high percentage of quartz contents in water that conveyed to turbine causes severe damage to a runner and blades [53].
Pangani and Rufiji basins consist of Pangani and Rufiji rivers of which all large hydropower of Tanzania located, are strongly affected by agricultural activities. The agricultural activities upstream of the river reduce the amount of water and loose the in situ land caused the sediment to flow into the reservoir during the wet season. Table 9 presents the agriculture activities practised in the existing hydropower plants in Tanzania. The general concerns related to barriers to hydropower development are presented in Table 10.
The agriculture activities within the catchment of hydropower plants of Tanzania.
Barriers and factors hindering the hydropower development.
5 Policy and regulations towards hydropower development
The appropriate policy and regulations can provide the platform for the sustainable renewable technologies in the urban and rural areas [63]. Energy policy interventions in Tanzania include the Energy Policy of year 2015, Electricity Act of year 2008, Energy and Water Utilities Authority (EWURA) Act of year 2001 and 2006, Rural Energy Act 2005, Standardized Power Purchase Agreement & Tariffs <10 MW of year 2008 and other programmes and strategies established to improve the energy recovery and supply to the communities [67]. The establishment of Energy Policy ensures the government to review for standardized power purchase agreement and tariff as well as the cost to reflect the developer's capital of investment. This Rural Energy Act 2005 established the Rural Electrification Agency (REA). It is responsible for promoting access to modern energy services in rural areas of mainland Tanzania and providing grants to developers of rural energy projects and to TANESCO for rural grid distribution investments.
The Small Power Producer (SPP) established in accordance with the Electricity Act, Cap.131, and rules to be issued by EWURA to provide guidelines to the producers. The guidelines include the Land Title Deed or Lease, water rights document, letter of intent, business registration, taxpayer identification and license, building permits, environmental and social clearances, Standardized Small Power Purchase Agreement (SPPA), EWURA license and approval of retail tariff and other detail descriptions as obtained in [68]. The existing of different energy acts helped to create a legal and regulatory framework to attract private investment to boost electricity supply [6]. It requires no license to produce less than 1 MW and considerably to improve the quality of life in rural areas [69].
6 Tariff system for hydropower plants
Renewable energy feed-in tariff (REFiT) is an incentive plan to provide a set of payment for electricity generated from investors include small-scale and large-scale developers. The establishment of REFiT observed as very complex task and requires the involvement in the technology innovations, market development and policy improvement [70]. It also involves the issues of geographical location, infrastructure, technical, institutional and economic assessment [71]. The term tariff refers to the rates and charges for selling and buying the electricity [72]. The feed-in tariff (FIT) is a policy mechanism to guarantee the price of electricity generation [73].
6.1 Status of tariff rating from 2008 to 2015
Tanzania has a tariff price for both grid-connected and isolated mini-grids SPP. Figure 6 presents the tariff price of main grid SPP purchases with wet and dry season adjustment as well as the isolated mini-grid as collected from [67]. It also presented the percentage increase in the tariff price from 2009 to 2015. The tariff price of isolated mini grid SPP indicated to increase from 2008 to 2013. The main grid SPP in both wet and dry seasons indicated the gradual increase from 2008 to 2015. The off-grid and main-grid tariff price indicated to increase from 2011 to 2012 up to 27% and 26% respectively and the coming year dropped to a significant percentage. It indicated the percentage decrease of 3.23% for main-grid SPP and increased by 2.35% for isolated mini-grid SPP in 2015. The tariff price of mini-hydro SPP competes very well with diesel generators to the rural electrification plan [71]. The reality, there is increased of the tariff, but yet not sufficient for cost recovery, as well as low creditworthiness, discourages financial sector and private investor [6].
The tariff price system changed to isolated mini hydropower plants with a capacity less than 10 MW are based on the United States Producer Price Index [74]. The use of price index provides the platform for each producer to have a different tariff price based on the capacity of power generated as presented in Figure 7. The tariff price is less for higher the capacity to produce and vice versa.
6.2 The principle of tariff design for electricity
The existing of electricity tariff principles were managed to respond the issues related to the economic sustainability and efficiency, equity, transparency, simplicity, stability and consistency. The choice of any tariff setting methodology requires the decision makers to make an informed compromise, reaching a balance between all the principles as discussed in [62]. The setting of electricity tariffs by the EWURA in Tanzania is necessary for the network segments of countries with liberalized electricity energy sectors and for all developers in countries [68]. The determination of the electricity tariff is either allowed revenues recovered or define the tariff structure and allocation of allowed costs [75]. The revenues recovered determined by either calculating the cost of service regulation or incentive-based regulation as described in [76]. EWURA estimates the tariff of isolated mini-grid SPP based on the cost-based tariff described in [68]. Also, TANESCO tariff setting based on the avoided costs either isolated mini-grid or main grid systems [69]. The advantageous of using REFiT were presented in Table 11.
Also, the barriers to renewable energy tariff include lacking in the purchase and grid access, involved of the stakeholders in the policies drafting, discovering the renewable energies in the future market and energy efficiency as well as the climate change negotiations [77]. Furthermore, the barriers of renewable energy differ from one form or another include technical, financial, legal and institutional framework. Other details of the renewable energy policies and barriers are described in [78]. It needs also to improve the renewable energy technologies to reduce the initial cost [79].
The advantages of using REFiT in Tanzania.
7 Conclusions
Tanzania has the energy policy and energy regulations sufficient to give the conducive environment for renewable energy development, especially hydropower resources. The existing tariff for isolated hydropower is well-distributed with respect to the capacity of electricity generated up to 10 MW. The advantages of having REFiT include the understanding of the technology used to generate the electricity, off-grid or grid-connected, financial, policy, regulations and consumed time. The number of hydropower components was made from worldwide manufacturers and well installed for electricity generation. The hydro turbine is selected on the basis of head and flow rate assessed from potential rivers. Other factors like power demand, civil works, electrical system, maintenance and efficiency are the necessary parameters to consider before developing the hydropower plant. It is still indicated the main barriers include the absence of grid access and lack of financial sectors to the areas of available renewable energy sources. Also, the accumulated of sediment in reservoirs mostly resulted from agricultural activities indicated to affect the hydropower production capacity.
Currently, hydropower plants capacity has reached 624.21 MW and expected to be extended up to 4.7 GW by the year 2040. The total hydropower capacity in operation, under construction and expected to be installed is about 4397.01 MW. In addition to that, the potential hydropower resource under reconnaissance and feasibility studies has reached 925.63 MW. The potential hydropower resource map of the three studies indicated the potential hydropower sites close to each other. There is a high possibility of the single site location found in three studies to present one hydropower site. Although, each feasibility study conducted separately and they do not consider previous studies. Importantly, hydropower plants do not consume water from the river but the challenge still remains to understand the annual flow variation. Therefore, further study should focus on the preparing the strategic plan to minimize the barriers and site visiting the potential hydropower sites and update the hydropower database of Tanzania.
Acknowledgments
This publication is part of ongoing PhD research work and supported by NORAD under Energy and Petroleum (EnPe) Programme at the University of Dar es Salaam (UDSM) in Tanzania and the Norwegian University of Science and Technology (NTNU) in Trondheim, Norway.
References
- Z. Ming, L. Ximein, L. Na, X. Song, Overall review of renewable energy tariff policy in China: evolution, implementation, problems and countermeasures, Renew. Sustain. Energy Rev. 25, 260–271 (2013) [CrossRef] [Google Scholar]
- S. Khurana, A. Kumar, Small hydropower − a review, Int. J. Eng. Sci. Metall. 1, 278–282 (2011) [Google Scholar]
- O. Sahin, R.A. Stewart, D. Giurco, M.G. Porter, Renewable hydropower generation as a co-benefit of balanced urban water portfolio management and flood risk mitigation, Renew. Sustain. Energy Rev. 68, 1076–1087 (2017) [CrossRef] [Google Scholar]
- REN21, Renewable Energy Policy Network for the 21st Century, Renewables 2015, in Global Status Report: Annual Reporting on Renewables (ten years of excellence) (Paris, France, 2016) [Google Scholar]
- URT, United Republic of Tanzania, Ministry of Energy and Minerals (National Energy Policy, Dar es Salaam, Tanzania, 2015) [Google Scholar]
- ADB, African Development Bank, Renewable Energy in Africa: Tanzania Country Profile (Ivory Coast, 2015) [Google Scholar]
- URT, United Republic of Tanzania, Power System Master Plan 2012 Update (Dar es Salaam, Tanzania, 2013) [Google Scholar]
- TANESCO, Tanzania Electric Supply Company, 2018, http://www.tanesco.co.tz/index.php?option=com_content&view=article&id=77&Itemid=166 [Google Scholar]
- M.L. Kolhe, K.M. Iromi-Udumbara-Ranaweera, A.G.B. Sisara-Gunawardana, Techno-economic sizing of off-grid hybrid renewable energy system for rural electrification in Sri Lanka, Sustain. Energy Technol. Assess. 11, 53–64 (2015) [Google Scholar]
- IEA, International Energy Agency, IEA energy statistics, electricity generation by fuel in Tanzania, 2017, http://www.iea.org/statistics [Google Scholar]
- IJHD, International Journal on Hydropower & Dams, World Atlas & Industry Guide (Wallington, Surrey, UK, 2010) [Google Scholar]
- E. Panos, H. Turton, M. Densing, K. Volkart, Powering the growth of Sub-Saharan Africa: the jazz and symphony scenarios of World Energy Council, Energy Sustain. Dev. 26, 14–33 (2015) [CrossRef] [Google Scholar]
- J. Xu, T. Ni, Integrated technological paradigm-based soft paths towards sustainable development of small hydropower, Renew. Sustain. Energy Rev. 70, 623–634 (2017) [CrossRef] [Google Scholar]
- C.S. Kaunda, C.Z. Kimambo, P.M. Ndomba, The development of microhydro for rural energy supply in Tanzania, Hydropower Dams 6, 60–66 (2012a) [Google Scholar]
- UNIDO-GEF, United Republic of Tanzania, Mini-grids Based on Small Hydropower Sources to Augment Rural Electrification in Tanzania (Vienna, 2015) [Google Scholar]
- REA, Rural Energy Agency, Annual Report 2014/2015, Tanzania, 2015 [Google Scholar]
- W.J. Klunne, E.G. Michael, Increasing sustainability of rural community electricity schemes − case study of small hydropower in Tanzania, in International Conference on Sustainable Energy and Technologies (Aachen, Germany, 2009) [Google Scholar]
- REA, Rural Energy Agency, Annual Report 2013/2014, Tanzania, 2014 [Google Scholar]
- AWF, African Water Facility, The United Republic of Tanzania, Feasibility study for the Kikonge multipurpose dam, Hydropower and Irrigation Project: Project Appraisal Report, 2016 [Google Scholar]
- E. Adebayo, B.K. Sovacool, S. Imperiale, It's about dam time: improving microhydro electrification in Tanzania, Energy Sustain. Dev. 17, 378–385 (2013) [CrossRef] [Google Scholar]
- E.L.B. Kassana, N. Gerard, D. Mashauri, Z. Hailu, D.J. Chambega, S.K. Makhanu et al., Small scale hydropower for rural development (Tanzania, 2005) [Google Scholar]
- K.T. Kabaka, F. Gwang'ombe, Challenges in small hydropower in Tanzania: renewable energy perspective, in International Conference on Small Hydropower (2007), pp. 22–24 [Google Scholar]
- ESMAP, Energy Sector Management Assistance Program, Small hydro resource mapping in Tanzania. Phase 1 Report, Washington DC 20433, USA, 2015 [Google Scholar]
- URT, United Republic of Tanzania, Ministry of Energy and Minerals, Power System Master Plan. 2016 Update (Dar es Salaam, Tanzania, 2016) [Google Scholar]
- J.L. Chukwuneke, C.H. Achebe, M.C. Nwosu, J.E. Sinebe, Analysis and simulation on the effect of head and bucket splitter angle on the power output of a Pelton turbine, Int. J. Eng. Appl. Sci. 5, 1–8 (2014) [Google Scholar]
- USBR, Reclamation managing water in the west, 2016, http://www.usbr.gov/power/edu/history.html [Google Scholar]
- B.J. Lewis, J.M. Cimbala, A.M. Wouden, Major historical developments in the design of water wheels and Francis hydroturbines, in IOP Conference Series: Earth and Environmental Science (IOP Publishing, 2014) [Google Scholar]
- R.E. Horton, Turbine Water-wheel Tests and Power Tables (Washington, 1906) [Google Scholar]
- J.L. Tylee, Chaos in a real system, Simulation 64, 176–183 (1995) [CrossRef] [Google Scholar]
- L.E. Matson, The Malkus-Lorenz water wheel revisited, Association of Physics Teachers, 2007, pp. 1114–1122 [Google Scholar]
- I. Loots, M. van Dijk, B. Barta, S.J. van Vuuren, J.N. Bhagwan, A review of low head hydropower technologies and applications in a South African context, Renew. Sustain. Energy Rev. 50, 1254–1268 (2015) [CrossRef] [Google Scholar]
- C.S. Kaunda, C.Z. Kimambo, T.K. Nielsen, A technical discussion on microhydropower technology and its turbines, Renew. Sustain. Energy Rev. 35, 445–459 (2014) [CrossRef] [Google Scholar]
- M.T. Gatte, R.A. Kadhim, Hydropower (Open Access Publisher, INTECH, 2012), pp. 95–124 [Google Scholar]
- A. Kumar, T. Schei, A. Ahenkorah, R. Caceres, R. Rodriguez, J.M. Devernay, M. Freitas et al., Hydropower, in IPCC Special Report On Renewable Energy Sources And Climate Change Mitigation, edited by O. Edenhofer, R. Pichs-Madruga, Y. Sokona, K. Seyboth, P. Matschoss, S. Kadner, T. Zwickel, P. Eickemeier, G. hansen, S. Schlömer, C. von Stechow (Cambridge University Press, The United Kingdom and New York, NY, USA, 2011) [Google Scholar]
- KBL, A Kirloskar Group Company, 2017, http://www.kirloskarpumps.com/product-hydro-turbines-kaplan-turbines.aspx [Google Scholar]
- STP, Small Turbine Partner, 2017, http://turbinepartner.no/wp-content/uploads/2014/01/Brosjyre-engelsk.pdf [Google Scholar]
- VOITH, Hydropower, 2017, http://voith.com/en/products-services/hydro-power-377.html [Google Scholar]
- Gilkes, Gilbert Gilkes & Gordon Ltd., 2017, http://www.gilkes.com/Hydropower [Google Scholar]
- ANDRITZ, Hydro, 2017, https://www.andritz.com/index/hydro/hy-large-new-installations-standard.htm [Google Scholar]
- SIAPRO, Siapro Hydropower Plants, 2017, http://en.hydro-electricity.eu/hydropower-plant-turn-key/siapro-hydropower-plants/ [Google Scholar]
- AGWV, Turbines, 2017, http://www.wkvag.com/en/produkte.html [Google Scholar]
- NHE, Nepal Hydro & Electric Limited, 2017, http://www.nhe.com.np/ [Google Scholar]
- MHU, Protel Multi Energy, 2017, http://www.pme-bandung.com [Google Scholar]
- C. Penche, Guide on how to develop a small hydropower plant, European Small Hydropower Association (European Renewable Energy Council, 2004) [Google Scholar]
- S.J. Williamson, B.H. Stark, J.D. Booker, Low head pico hydro turbine selection using a multi-criteria analysis, in World Renewable Energy Congress 8-13 May 2011, (Hydropower Application, Linkoping, Sweden, 2011), pp. 1377–1385 [CrossRef] [Google Scholar]
- E.N. Smit, Micro hydro power generation, final year project report, Stellenbosch University, Faculty of Engineering, 2005 [Google Scholar]
- DHP, Direct Hydro Power, 2017, http://www.inforse.org/europe/dieret/Hydro/hydro.html [Google Scholar]
- HRET, Hydro Resource Evaluation Tool, Turbine selection, 2017, http://www.engineering.lancs.ac.uk/lureg/nwhrm/engineering/ [Google Scholar]
- J.M. Chapallaz, P. Eichenberger, G. Fischer, Manual on Pumps Used as Turbines (Vieweg, Braunschweig: Printed in the Federal Republic of Germany by Lengericher Handelsdruckerei, Lengerich, 1992) [Google Scholar]
- T.T. Borji, Sedimentation and Sustainability of Hydropower Reservoirs: Cases of Grand Ethiopian Renaissance Dam on the Blue Nile River in Ethiopia (Trondheim, 2013) [Google Scholar]
- D.B. Lysne, H. Glover, H. Stole, E. Tesakar, Hydraulic Design (Norwegian Institute of Technology, Trondheim, 2003) Vol. 8 [Google Scholar]
- G. Morris, Sustainable sediment management reservoirs, 2015, www.reservoirsedimentation.com [Google Scholar]
- H.P. Neopane, Sediment Erosion in Hydro Turbines (Trondheim, Norway, 2010) [Google Scholar]
- Y.W. Shaghude, Review of water resource exploitation and landuse pressure in the Pangani river basin, West. Indian Ocean J. Mar. Sci. 5, 195–207 (2006) [Google Scholar]
- J.K. Turpie, Y.M. Ngaga, F.K. Karanja, Catchment Ecosystems and Downstream Water: The Value of Water Resources in the Pangani Basin (Tanzania, 2005) [Google Scholar]
- E. Rached, E. Rathgeber, D.B. Brooks, Water Management in Africa and the Middle East: Challenges and Opportunities (Cairo, 1996) [Google Scholar]
- G. Jambiya, Restoring the flows in the Great Ruaha river, World Wildlife Fund, 2005 [Google Scholar]
- S. Savage, M. Shadrack, Opportunities and challenges for sustainable water resources management in Tanzania, 2008 [Google Scholar]
- F.L. Mwanuzi, Assessment of water quality for Pangani river in Tanzania using QUAL2E windows version, in 1st WARFSA/WaterNet Symposium: Sustainable Use of Water Resources (Maputo, 2000), pp. 1–8 [Google Scholar]
- R. Andersson, F. Wänseth, M. Cuellar, U. von Mitzlaff, Pangani Falls Re-Development Project in Tanzania (Sweden, 2006) [Google Scholar]
- H. Ahlborg, L. Hammar, Drivers and barriers to rural electrification in Tanzania and Mozambique grid-extension, off-grid, and renewable energy technologies, Renew. Energy 61, 117–124 (2014) [CrossRef] [Google Scholar]
- W. Rickerson, C. Hanley, C. Laurent, C. Greacen, Implementing a global fund for feed-in tariffs in developing countries: a case study of Tanzania, Renew. Energy 49, 29–32 (2013) [CrossRef] [Google Scholar]
- F.S. Javadi, B. Rismanchi, M. Sarraf, O. Afshar, R. Saidur, H.W. Ping et al., Global policy of rural electrification, Renew. Sustain. Energy Rev. 19, 402–416 (2013) [CrossRef] [Google Scholar]
- C.S. Kaunda, C.Z. Kimambo, T.K. Nielsen, Potential of small-scale hydropower for electricity generation in Sub-saharan Africa: review article, Renew. Energy 2012, 132606 (2012b) [Google Scholar]
- A.H. Mondal, L.M. Kamp, N.I. Pachova, Drivers, barriers, and strategies for implementation of renewable energy technologies in rural areas in Bangladesh − an innovation system analysis, Energy Policy 38, 4626–4634 (2010) [CrossRef] [Google Scholar]
- C.S. Kaunda, C.Z. Kimambo, T.K. Nielsen, Hydropower in the context of sustainable energy supply: a review of technologies and challenges, Renew. Energy 2012, 730631 (2012c) [Google Scholar]
- URT, United Republic of Tanzania, Ministry of Energy and Minerals: Energy Sector (Tanzania, 2016) [Google Scholar]
- EWURA, Energy and Water Utilities Regulatory Authority, Guidelines for Development of Small Power Projects (Dar es Salaam, Tanzania, 2011) [Google Scholar]
- EWURA, Energy and Water Utilities Regulatory Authorities, Small Power Projects (Tanzania, 2008) [Google Scholar]
- K. Kim, C. Lee, Evaluation and optimization of feed-in tariffs, Energy Policy 49, 192–203 (2012) [CrossRef] [Google Scholar]
- M. Moner-Girona, R. Ghanadan, M. Solano-Peralta, I. Kougias, K. Bódis, T. Huld et al., Adaptation of feed-in tariff for remote mini-grids: Tanzania as an illustrative case, Renew. Sustain. Energy Rev. 53, 306–318 (2016) [CrossRef] [Google Scholar]
- MEM, Ministry of Energy and Minerals, Energy and Water Utilities Regulatory Authority. Tariff Application Guidelines of 2009 (Dar es Salaam, 2009) [Google Scholar]
- K. Lo, A critical review of China's rapidly developing renewable energy and energy efficiency policies, Renew. Sustain. Energy Rev. 29, 508–516 (2014) [CrossRef] [Google Scholar]
- EWURA, Energy and Water Utilities Regulatory Authority, The Electricity Standardized Small Power Projects Tariff (Tanzania, 2015) [Google Scholar]
- G. Trypolska, An assessment of the optimal level of feed-in tariffs in Ukraine, Sustain. Energy Technol. Assess. 7, 178–186 (2014) [Google Scholar]
- D. Peng, R. Poudineh, Sustainable Electricity Pricing for Tanzania (Oxford Institute for Energy Studies, 2016) [CrossRef] [Google Scholar]
- A. Pegels, Renewable energy in South Africa: potentials, barriers and options for support, Energy Policy 38, 4945–4954 (2010) [CrossRef] [Google Scholar]
- F. Beck, E. Martinot, Renewable energy policies and barriers, Encycl. Energy 5, 365–383 (2004) [Google Scholar]
- L. Liu, C. Liu, J. Wang, Deliberating on renewable and sustainable energy policies in China, Renew. Sustain. Energy Rev. 17, 191–198 (2013) [CrossRef] [Google Scholar]
Cite this article as: Ombeni J. Mdee, Torbjorn K. Nielsen, Cuthbert Z. Kimambo, Joseph Kihedu, Assessment of hydropower resources in Tanzania. A review article, Renew. Energy Environ. Sustain. 3, 4 (2018)
All Tables
List of existing/reconnaissance/pre-feasibility/feasibility studies for hydropower sites.
The agriculture activities within the catchment of hydropower plants of Tanzania.
All Figures
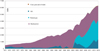 |
Fig. 1 Electricity generation by different fuel sources in Tanzania from 1971 to 2015 [10]. |
| In the text | |
|
Fig. 2 Potential hydropower resources map of Tanzania. |
| In the text | |
|
Fig. 3 Hydropower resources status in Tanzania. |
| In the text | |
 |
Fig. 4 Electricity generation by using hydropower resources with different plant factors [24]. |
| In the text | |
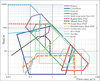 |
Fig. 5 Turbine selection chart based on head and flow rate [47–49]. |
| In the text | |
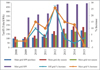 |
Fig. 6 Tariff price of Tanzania from 2008 to 2015 [67]. |
| In the text | |
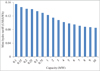 |
Fig. 7 Mini hydropower projects tariff rate for 2015 [74]. |
| In the text | |
Current usage metrics show cumulative count of Article Views (full-text article views including HTML views, PDF and ePub downloads, according to the available data) and Abstracts Views on Vision4Press platform.
Data correspond to usage on the plateform after 2015. The current usage metrics is available 48-96 hours after online publication and is updated daily on week days.
Initial download of the metrics may take a while.