Open Access
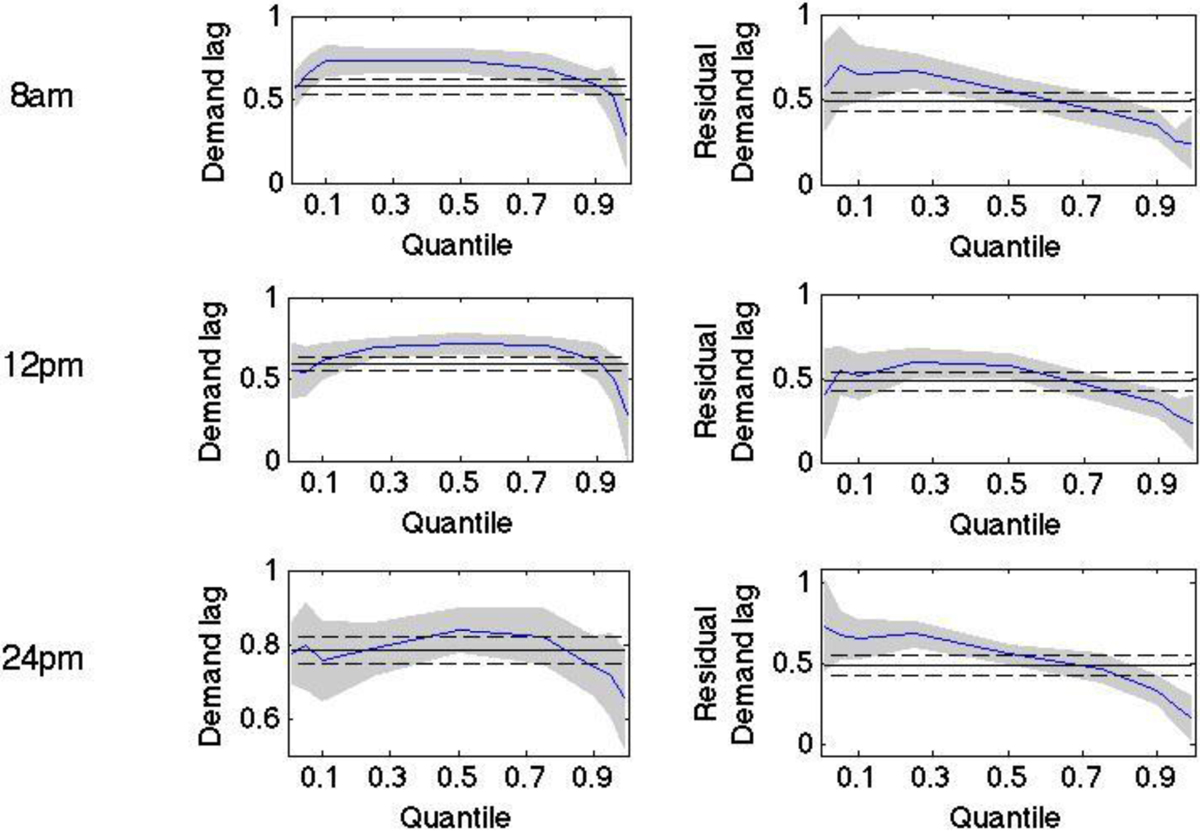
Fig. 3
Download original image
Ordinary and quantile regression estimates for demand and residual demand. The shaded area represents 95% confident band for the blue quantile regression line. The dotted lines are the confident band for the ordinary regression estimates.
Current usage metrics show cumulative count of Article Views (full-text article views including HTML views, PDF and ePub downloads, according to the available data) and Abstracts Views on Vision4Press platform.
Data correspond to usage on the plateform after 2015. The current usage metrics is available 48-96 hours after online publication and is updated daily on week days.
Initial download of the metrics may take a while.