| Issue |
Renew. Energy Environ. Sustain.
Volume 7, 2022
|
|
|---|---|---|
| Article Number | 17 | |
| Number of page(s) | 12 | |
| DOI | https://doi.org/10.1051/rees/2022003 | |
| Published online | 21 June 2022 | |
Research Article
Analysing data quality frameworks and evaluating the statistical output of United Nations Sustainable Development Goals’ reports
University of Bolton, Bolton, England, UK
* e-mail: This email address is being protected from spambots. You need JavaScript enabled to view it.
Received:
12
December
2021
Received in final form:
3
February
2022
Accepted:
4
February
2022
Abstract
This paper evaluates the quality of the United Nations Sustainable Development Goals’ report for 2020, and devises a new data quality assessment framework based on analysing many data quality frameworks. Data in this paper is collected from the official UN SDG official website, and the national statistics offices of the UN countries. A weighted-score sum module is also being utilized to find the best data quality dimension. These dimensions are then used to create a new data quality framework. It is found that the UN SDGs used a data quality framework that is based on statistical output factors and ignores other quality factors and therefore the score for assessing this report is 56%. The perceived identified gaps include: countries are using different quality and assessment frameworks which cause inconsistency in data quality; data is outdated and incomplete; data is not available for many indicators and countries; cost and efficiency are not part of the UN SDG data quality framework; therefore weak data management is found. Areas for improvement include creating one comprehensive data quality framework for all countries will ensure the highest data quality.
Key words: Data quality assessment framework / Factors of data quality / Dimensions of data quality indicators / Data quality management / Data Governance / UN SDGs
© W. Al-Salim et al., Published by EDP Sciences, 2022
 This is an Open Access article distributed under the terms of the Creative Commons Attribution License (https://creativecommons.org/licenses/by/4.0), which permits unrestricted use, distribution, and reproduction in any medium, provided the original work is properly cited.
2 Introduction
Data quality refers to the state of information being evaluated under the governance of data owners. Many definitions are coined to satisfy the importance of decisions made after consuming that data. It is an essential asset for any decision-maker, and it may cause detrimental effects in the short or long term for all projects. The quantity of data is increasing dramatically, and it needs to be controlled by new, fast and intelligent evaluating methods; otherwise, many wrong decisions will be generated.
Countries have their data quality frameworks, and their statistical offices are charged with implementing frameworks and establishing processes to ensure an acceptable level of data quality (DAMA, 2009).
On the other hand, many academic papers introduce frameworks to overcome problems related to the huge number of data frameworks. Still, these are not capable of competing with countries’ official frameworks due to the budget allocated to them and huge number of teams who oversee monitoring, updating, and enforcing all the governance practices (Ramdasi et al., 2019).
To achieve the highest data quality, many Data Quality Assessment Frameworks (DQAF) provide a guide for data stakeholders. It is not easy to choose from them and find the most suitable framework that is sufficient to satisfy business needs (Cichy & Rass, 2019).
2 Literature review
2.1 Data quality
Quality, as a general term, is a set of characteristics that can meet predefined requirements. Therefore, data quality is defined as a set of predefined qualities planned, implemented, and controlled to meet data stakeholders’ expectations.
Other definitions were introduced by data quality practitioners (Tab. 1) to meet data natural evolution and progress for the field of data management and the big data era.
The Data Management Association (DAMA) asserts that data management overall should be a shared responsibility (DAMA, 2009). But many organisations struggle with how to make it one. On the question of data quality, most experts agree that businesspeople (rather than IT people) need to define what constitutes high-quality data. This idea is often phrased in terms of ownership, as in “the business should own the data”. However, business people need the right guidance to improve data quality inside the systems where data is stored. IT staff are responsible for those systems. Information systems and the data they contain are integral to running today’s organisations. IT exists because organisations require technology to operate. IT needs to see itself in closer relation to the business processes it supports. This relation includes having a better understanding of data content to ensure a higher level of data quality. It is essential to consider that data quality is multidimensional because of its wide variety of data stakeholders like data consumers, data producers, data providers, and data custodians (Fürber, 2016).
Measuring data quality is related to measuring its multi-dimensions and indicators. They must be calculated to represent a reliable reflection of the collected data. However, they may introduce a problem for all data-driven countries or organisations.
A chronicle order for data quality definitions.
2.2 Data quality dimensions
According to Mahanti (2019), data quality dimensions are measures or benchmarks to analyse data quality for a dataset, and this process includes understanding every aspect within the dataset like dataset size, data types, and default values. These measurements have to be categorised according to different data measurements. For example, measuring the validity dimension refers to whether data values are consistent with a defined domain of values (Plotkin, 2014). It is also essential to align and measure data quality dimensions with business processes, and these measures are the data values that are ruled by the system to be validated (Loshin, 2009).
The term dimension is used to highlight data features that can be measured and through which data quality may be described and quantified as mentioned in the topic of data quality. Data quality dimensions are quite abstract as a high-level category. Dimensions like completeness, validity, timeliness, consistency, and integrity are among the DQAF’s dimensions. Dimensions of data quality are crucial to understanding how data quality is measured (Sebastian-Coleman, 2013).
According to Loshin (2001), associate thresholds with data quality requirements and the measurements that show those requirements are met. Specific metrics can have a threshold if they measure an aspect of data to which a threshold applies—for example, the level of defaulted records. In many cases, especially for consistency measurement types, they measure a set of values, each of which is associated with a percentage of records, so there is no threshold for the overall set. There is instead an expectation of consistency.
These dimensions are well researched and investigated by three researchers (Loshin, 2009; Loshin, 2011; Sebastian-Coleman, 2013). Several countries decided to include some of these dimensions in their DQF based on their understanding, needs, and feedback from NSOs. It is essential to notice that many DQFs are not following or using the exact quality dimensions or the same definitions all the time. According to Nederpelt and Black (2020), there are currently 60 quality dimensions, but the literature survey for this study discovered that many countries are using less than twelve dimensions only (see Tab. 2).
Content and cross-tabulation analysis for the most frequent data quality dimensions and their related DQFs, collated from literature and NSOs. (Created by the author).
3 Material and methods
3.1 Study design and procedure
A mixed approach research study is implemented for evaluating the data quality for the 2020 UN SDG report. Therefore, a case study was developed to focus on identifying what, where, when and how data quality problems occur in UN SDG reports.
Data were acquisitioned from official sources. For example, the online database for United Nations Sustainable Development Goals (UN SDGs) Report 2020, and the National Statistics Offices (NSOs); this was deemed a very effective and efficient data collection process (Sarkar, et al., 2018).
The case study measured the twelve data quality dimensions of accuracy, timeliness, completeness etc., as detailed in Table 2 to evaluate UN SDG reports and quality management. For this, the research questions included “What is the data quality dimension used for by UN SDG data quality framework?” “What are the new factors to include in the new DQAF to improve the data quality?” and “What is the score for evaluating the UN SDG raw data quality?”.
Twelve data quality frameworks were examined using a simple random sampling method for the top-rated countries and according to the Data Quality Index report for 2018 (Data Quality Index, 2018). These frameworks represented different data quality levels of the nations (see Tab. 3). Eligible DQFs were selected from the countries listed under the 2020 UN SDG report. The inclusion criteria were countries missing proper DQFs, including data collection or entry, analysis, data audit, or data use.
The data collection instrument was used to collect the data from the government’s National Statistics Offices to ensure validity and reliability. Meanwhile, countries with high UN SDG scores were selected to evaluate the UN SDG data quality, while other ranked countries were chosen to check if they have DQFs or not.
Many countries used DQAFs to evaluate the data quality before submitting the final reports to the UN SD. Therefore, Multiple Criteria Decision Analysis (MCDA) as a sub-discipline of operations research (Köksalan et al., 2011) will be used to evaluate multiple DQFs and their quality dimensions to reduce the risk of choosing less important data quality dimensions and reach the best decisions.
According to Fishburn (1967), the weighted sum model (WSM) as one of the MCDA methods is best used for evaluating all the highly ranked DQFs according to the 2020 UN SDG report and will help reduce the number of data quality dimensions.
Assuming that an MCDA problem is described by m alternative dimensions and n dimensions’ decision criteria with the value of 0 or 1. Also, suppose that all criteria are benefit criteria, meaning that the higher the weight value, the better. Assume that wj signifies the relative criterion weight of importance Cj, and that dij is the performance value of alternative Ai when compared to criterion Cj. The overall (i.e., when all criteria are taken into account at the same time) relevance of alternative Di, designated as DiWSM-score, is then calculated by equation (1), initially introduced by Fishburn (1967):
 (1)
(1)
The design of the new DQF (Fig. 1) is equipped with a database of all the known DQFs, quality dimensions, data quality indicators and controlled by an artificial intelligence (AI) engine. The AI engine under this framework can discover new DQFs and data quality dimensions by utilising any new AI technologies like machine learning and data mining. This engine will give the framework the ability to be more dynamic towards any future changes or challenges.
To avoid choosing unrealistic dimensions that lead to low-level evaluation reports, this study has investigated other DQFs and looked at their desirable dimensions to find common ground between all of these frameworks and reach a sound judgment.
A list of most used data quality dimensions, and we assigned a weight for each dimension according to the level of its utilisation with other DQFs. These weights are then used to create a list of ordered dimensions used later to evaluate the UN SDG data.
Overview of data quality frameworks collected from the NSOs for top-scored countries according to the 2020 UN SDG report.
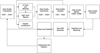 |
Fig. 1 The suggested data quality framework for improving data quality. |
3.2 Data analysis
All the NSOs were investigated to find if they have a DQF or not. All the DQFs in this paper were downloaded directly from the official NSO website to ensure their validity before analysing the data. After analysing all the DQFs, a new DQAF was created to evaluate the 2020 UN SDG report data. Data analysis was conducted in four steps thus:
Step 1. Each DQF was analysed to find the data quality dimensions and used to build a database for these frameworks. As this step was conducted manually, a potential error was addressed by repeating this step three times.
Step 2. Creating a weighted sum model for all the DQDs. Every dimension was weighted according to its existence in other DQFs. The WSM method helped develop a new DQF, which has all the agreed-on dimensions and the desired acceptance level.
Step 3. UN SDG reports analysis. The 2020 UN SDG report data were evaluated according to the dimensions and weights concluded from this study. Each dimension was evaluated according to a citation from an authoritative publication or statistical metric.
Step 4. The analysis results were compared to the Data Quality index to ensure accuracy and of content analysis. Guided by the DQF, the suggested quality factors served as improvement strategies to fill in the gaps for quality improvement.
4 Results
4.1 Quality of the UN SDG DQF
After calculating the WSM to generate all the dimensions’ weights listed under the nine data quality frameworks, twelve dimensions were only confirmed, due to their high weights. Four dimensions (Accuracy, Timeliness, Relevancy and Accessibility) scored 51.42% of the total amount of weights.
Accuracy/reliability, timeliness/punctuality, accessibility/clarity and consistency/coherence/comparability) were the first dimensions which are selected due to their high weighted score of 15% and their most common existence in every single DQF (see Tab. 4). Also can be seen that the accessibility/clarity dimension scored 14.29% and was common in every DQF but the UKDQF.
The proportion of dimensions confirmed for statistical factors was found very high at 79%; with the other factors, the proportions were 8% (6/80) for interpretability and metadata management while 3% (2/80) for integrity, 1% (1/80) was calculated for completeness, validity, uniqueness, reliance, trustworthiness, granularity, cost and efficiency.
Lastly, and according to the weighted sum calculations, UN DQF scored 85%, the second-highest score after the Australian and Indonesian DQFs at 92.5%. Surprisingly, UK DQF scored only 65% but above 90% under the data quality index.
The WSM calculations results shown in Figure 2 indicate that accuracy, timeliness, and relevancy are the most important dimensions with 15% weight of importance. This was followed by less essential dimensions like accessibility, comparability consistency, interpretability, integrity and institutional environment with a weighted score ranged between 13% to 2%.
On the other side, seven dimensions like completeness, validity, uniqueness, reliance, trustworthiness, granularity, and efficiency seem less important than different dimensions with a weighted score of 1%.
Cross Table to measure the weights for data quality dimensions.
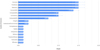 |
Fig. 2 The weights for the most used data quality dimensions according to the literature survey and the calculations of weighted sum model. |
4.2 Quality of the 2020 UN SDG report data
Of the 16 quality dimensions, only 12 (75%) dimensions were selected to evaluate the raw data quality. Of these, six dimensions are considered statistical factors.
The (SDR2020RawData.csv) was analysed for 12 data quality dimensions under different weights, and it was found that the total score is 56%.
The proportion of statistical factors was low at 43%; whereas with other dimensions the proportion were 7% for interpretability and data management, 2% for integrity, less than or equal to 1% for completeness, validity, user needs, trade-offs, uniqueness and granularity.
Data analysis reveals that the missing data were 51.25%. Data imputation methods were used to cover 49.78% of missing indicators, 4.3% for 2020 reference data, 48.69% for the data collected before 2018 28.69% for the SDG indicators with no data.
Another major data quality problem is related to the number of years covered in these reports;. In contrast, the report should include recent data; the study analysis indicates that a very large proportion, 48.69% is outdated and older than 3 years (see Fig. 3).
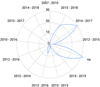 |
Fig. 3 Radar chart shows a large amount of old and missing data in the 2020 UN SDG report. |
4.3 Perceived gaps in the 2020 UN SDG report and proposed improvement strategies to address these gaps
The gaps analysis and literature survey for the UN SDG report shows low-quality data (see Tab. 5), and to fill these gaps, a new DQF is introduced to handle these data quality gaps.
The gaps declared in the 2020 UN SDG report indicates many data quality issues included:
Data are not complete for many countries.
Very long time to process data by the official NSOs.
Insufficient amount of data from many low-income countries.
Use of traditional data analysis methods.
Outdated data may cause inaccurate insights or decisions.
Data is collected from different sources with different DQFs.
Data quality improvement strategies concluded from the literature survey and gap analysis (see Tab. 5) include:
The need for a new standard, smart and dynamic DQF.
Improved data collection times and reduced data collection processes from NSOs to a lower crowdsource level.
Adding more DQ dimensions that are able to handle “Big Data”.
Data quality gaps for the UN SDG report according to current literature and reports.
5 Discussion
Data sources are essential for leaders to make the right decisions, and inefficiencies may cause delays to obtain accurate information, which is often the case for many NSOs, and other authoritative organisations or academic papers. This study evaluated the quality of UN SDG report data. Through a literature survey about data quality frameworks from national statistics offices and academic papers, the article confirmed with evidence the low data quality for the 2020 UN SDG report at 85%. The findings of this paper identified the data quality dimensions that cause the low level of reported data and pointed out the report data gaps. Results have also recommended that the current NSO DQFs must follow one standard DQF to ensure the maximum alignment between their data quality and other countries see Figure 4. The analysis identified four data quality frameworks that scored the highest at 92.5% because of their shared dimensions of data quality. Otherwise, data quality will be suffering from multidimensional misinterpretation. Data quality dimensions are evolving over the years, and some of the dimensions are required to serve a specific technology era. The AI era requires new data quality dimensions, and not having a flexible and dynamic DQ framework may cause server data quality damage. Many top-ranked countries reported missing data due to a lack of people support for the national census or unexpected problems like the Covid-19 pandemic. Unfortunately, following the existing method will continue to produce long delays in obtaining accurate and timely data. One approach to deal with the timeliness dimension is to get the data directly for the lowest source, in the case of the people or the IoT sensors. Collecting data for lower sources may cause reliability and validation issues. Therefore, new DQFs should support new dimensions that can deal with new AI era quality dimensions. Big data related dimensions or DQFs, for example, are still under the level of countries implementation, while many academic research publications introduce new DQFs to support the massive amount of further data. The leadership decision of choosing DQFs cannot be controlled by people outside the closed and trusted circle of data users. Still, every data owner or provider should understand that data quality is essential to achieve sustainability for the short and long term.
6 Conclusion
This article concluded that the Top-rated countries under the 2020 UN SDG report evaluation had had high-quality data quality frameworks with customised dimensions and strong governance that helped them achieve high levels of data quality. Another important conclusion shows that each country has a distinctive dimension order and evaluation rates based on their NSOs experts’ feedback. This has to be applied widely to other frameworks and in every evaluation process. It has led to conclude that having one static framework with its dimensions is not suitable for new data challenges for AI. Therefore, a dynamic and smart framework should be forced by higher authorises and decision-makers. Many quality dimensions, like the accuracy, scored very high, and it is the most desirable dimension for many DQFs. In contrast, other dimensions, like integrity, scored very low, which may raise many questions related to the validity of other DQFs’ decisions to eliminate or approve some dimensions. Likewise, the completeness dimension scored very low, which may cause many problems related to statistical calculations and conclusions. Lastly, the United Nations countries and related organisations should follow one standard, smart and dynamic DQF, to ensure the highest data quality for every single country under the UN umbrella; otherwise, using different and scattered data quality frameworks will reduce data quality dramatically. Lastly, the amount of missing data is so huge, and many NSOs are unable to fill this gap. Therefore, the UN has to collect data directly from data owners and ensure the data quality throughout one standard and global DQF that is able to ensure the highest data quality.
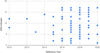 |
Fig. 4 Scatter chart shows a significant amount of data is available before 2018. |
Acronyms and abbreviations
AI Artificial intelligence
API Application programming interface
CGD Citizen-generated data
DQ Data quality
DQAF Data quality assessment framework
DQD Data quality dimension
DQF Data quality framework
IoT Internet of things
NGO Non-governmental organisation
NSO National Statistical Office
NSS National statistical system
ODA Official development assistance
SDG Sustainable development goal
UN SD United Nations Statistics Division
UN SDG United Nations sustainable development goals
References
- A. Black, P. van Nederpelt, Dictionary of dimensions of data quality (3DQ) (2020a). [online] Available at: http://www.dama-nl.org/wp-content/uploads/2020/11/3DQ-Dictionary-of-Dimensions-of-Data-Quality-version-1.2-d.d.-14-Nov-2020.pdf [Accessed 24 July 2021] [Google Scholar]
- A. Black, P. van Nederpelt, Data concept system for Data Quality Dimensions. Research paper. DAMA-NL (2020) [Google Scholar]
- A. Black, P. van Nederpelt, Dimensions of Data Quality Dimensions. Research paper. DAMA-NL (2020) [Google Scholar]
- C. Cichy, S. Rass, An overview of data quality frameworks, IEEE Access 7, 24634–24648 (2019) [CrossRef] [Google Scholar]
- DAMA, DAMA-DMBOK. Data Management Body of Knowledge 2nd Edition. Technics Publications LLC (2017) [Google Scholar]
- DAMA-UK, The six primary dimensions for data quality assessment (2013) [Google Scholar]
- DAMA, The DAMA guide to the data management body of knowledge (Technics Publications, Bradley Beach, NJ, 2009) [Google Scholar]
- S. Earley, The DAMA Dictionary of Data Management, 2nd Edition (Technics Publications LLC, NJ, 2011) [Google Scholar]
- European Statistical System, Quality Assurance Framework of the European Statistical System (2019). Retrieved from ec.europa.eu [Google Scholar]
- Federal Committee on Statistical Methodology, A Framework for Data Quality (2020). Available at: https://nces.ed.gov/FCSM/pdf/FCSM.20.04_A_Framework_for_Data_Quality.pdf [Accessed 24 July 2021]. [Google Scholar]
- P. Fishburn, Letter to the Editor—Additive utilities with incomplete product sets: application to priorities and assignments, Oper. Res. 15, 537–542 (1967) [CrossRef] [Google Scholar]
- C. Fürber, Data Quality Management with Semantic Technologies (Gabler, Wiesbaden, 2016) [Google Scholar]
- Government Data Quality Hub, The Government Data Quality Framework (2020). Available at: https://www.gov.uk/government/publications/the-government-data-quality-framework/the-government-data-quality-framework [Accessed 24 July 2021] [Google Scholar]
- M. Köksalan, J. Wallenius, S. Zionts, Multiple Criteria Decision Making: From Early History to the 21st Century (World Scientific, Singapore, 2011) [Google Scholar]
- D. Loshin, Enterprise Knowledge Management: The Data Quality Approach (Morgan, Boston, MA, 2001) [Google Scholar]
- D. Loshin, The Practitioner’s Guide to Data Quality Improvement (Morgan Kaufmann, Boston, MA, 2011) [Google Scholar]
- R. Mahanti, Data quality: Dimensions, measurement, strategy, management and governance (ASQ Quality Press, Milwaukee, 2019) [Google Scholar]
- P. Ramdasi, S. Salgarkar, A. Kolee, Data in future cities - improving the quality of analytics through simplified data quality assessment framework, SSRN Electr. J. (2019). [Google Scholar]
- L. Sebastian-Coleman, Measuring Data Quality for Ongoing Improvement (Morgan Kaufmann, San Francisco, CA, 2013) [Google Scholar]
- N.Z. Stats, Census data quality management strategy (2018). Retrieved from www.stats.govt.nz [Google Scholar]
- United Nations, The Sustainable Development Goals Report 2019 (2019). Available at: https://unstats.un.org/sdgs/report/2019/The-Sustainable-Development-Goals-Report-2019.pdf [Accessed 24 July 2021]. [Google Scholar]
- Y. Wand, R.Y. Wang, Anchoring data quality dimensions in ontological foundations, Commun. ACM 39, 86–95 (1996) [CrossRef] [Google Scholar]
- F. Wang, S. Mäs, W. Reinhardt, A. Kandawasvika, Ontology-based quality assurance for mobile data acquisition, in Proceedings of the 19th International Conference on Informatics for Environmental Protection: Networking Environmental Information (2005) [Google Scholar]
- R.Y. Wang, A product perspective on total data quality management, Commun. ACM 41, 58–65 (1998) [CrossRef] [Google Scholar]
- R.Y. Wang, D.M. Strong, Beyond accuracy: what data quality means to data consumers, J. Manag. Inf. Syst. 12, 5–33 (1996) [CrossRef] [Google Scholar]
- R.Y. Wang, D.M. Strong, Beyond accuracy: what data quality means to data consumers, J. Manag. Inf. Syst. 12, 5–33 (1996) [CrossRef] [Google Scholar]
- X. Wang, H.J. Hamilton, Y. Bither, An Ontology-Based Approach to Data Cleaning (Technical Report No. 0773105336 9780773105331) (Department of Computer Science, University of Regina, Regina, 2005) [Google Scholar]
- X. Wang, X. Sun, F. Cao, L. Ma, N. Kanellos, SMDM: enhancing enterprise-wide master data management using semantic web technologies, VLDB Endowment 2, 1594–1597 (2009) [CrossRef] [Google Scholar]
- Y.R. Wang, M. Ziad, Y.W. Lee, Data Quality (Kluwer Academic Publishers, Boston, 2001) [Google Scholar]
- M. West, Developing High Quality Data Models (2003) 1–56. Retrieved from https://d2024367-a-62cb3a1a-s-sites.googlegroups.com/site/drmatthewwest/publications/princ03.pdf [Google Scholar]
- M. West, Developing High Quality Data Models (Elsevier, 2011) [Google Scholar]
- S. Zionts, J. Wallenius, An interactive programming method for solving the multiple criteria problem, Manag. Sci. 22, 652–663 (1976) [CrossRef] [Google Scholar]
Cite this article as: Wajdi Al-Salim, Abdul Salam K. Darwish, Peter Farrell, Analysing data quality frameworks and evaluating the statistical output of United Nations Sustainable Development Goals’ reports, Renew. Energy Environ. Sustain. 7, 17 (2022)
All Tables
Content and cross-tabulation analysis for the most frequent data quality dimensions and their related DQFs, collated from literature and NSOs. (Created by the author).
Overview of data quality frameworks collected from the NSOs for top-scored countries according to the 2020 UN SDG report.
Data quality gaps for the UN SDG report according to current literature and reports.
All Figures
|
Fig. 1 The suggested data quality framework for improving data quality. |
| In the text | |
|
Fig. 2 The weights for the most used data quality dimensions according to the literature survey and the calculations of weighted sum model. |
| In the text | |
|
Fig. 3 Radar chart shows a large amount of old and missing data in the 2020 UN SDG report. |
| In the text | |
|
Fig. 4 Scatter chart shows a significant amount of data is available before 2018. |
| In the text | |
Current usage metrics show cumulative count of Article Views (full-text article views including HTML views, PDF and ePub downloads, according to the available data) and Abstracts Views on Vision4Press platform.
Data correspond to usage on the plateform after 2015. The current usage metrics is available 48-96 hours after online publication and is updated daily on week days.
Initial download of the metrics may take a while.