Open Access
Fig. 13
Download original image
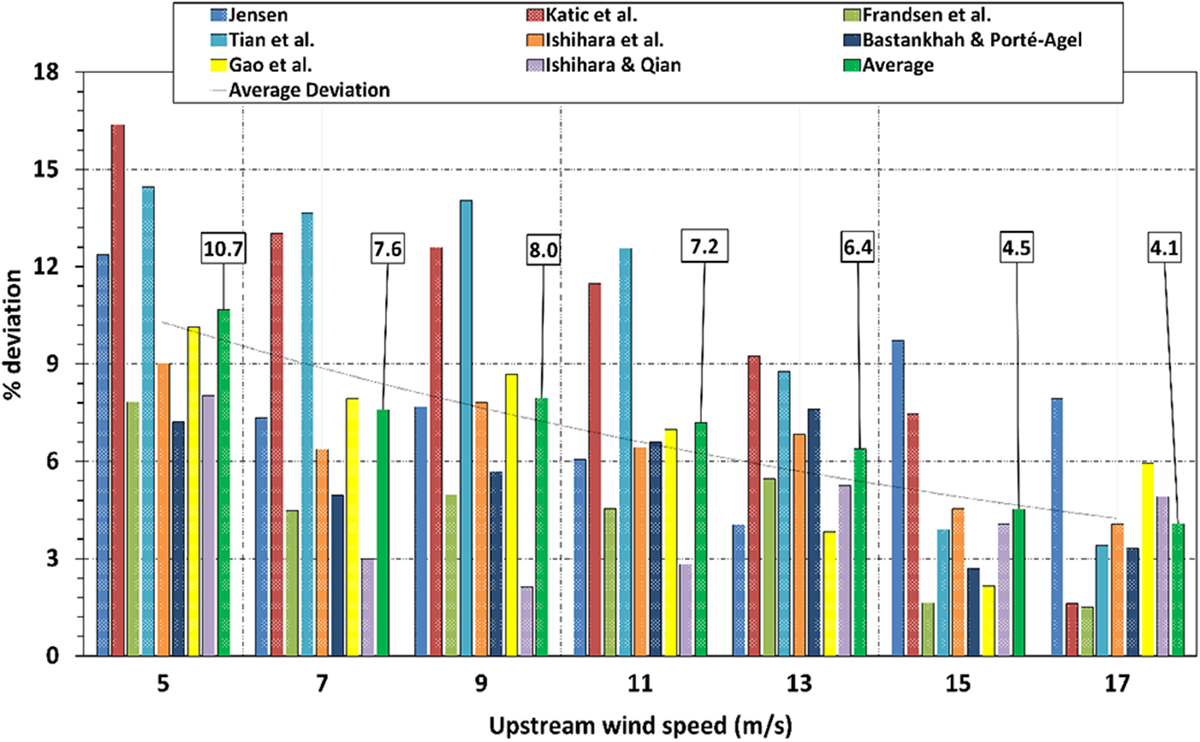
Percentage deviation per wake model and upstream wind speed in the entire far-wake region. Note: The green column (with the data labels) depicts the average percentage deviation of all wake models investigated.
Current usage metrics show cumulative count of Article Views (full-text article views including HTML views, PDF and ePub downloads, according to the available data) and Abstracts Views on Vision4Press platform.
Data correspond to usage on the plateform after 2015. The current usage metrics is available 48-96 hours after online publication and is updated daily on week days.
Initial download of the metrics may take a while.